What is a memory leak?
A memory leak occurs when a process allocates memory from the paged or nonpaged pools, but does not free the memory. As a result, these limited pools of memory are depleted over time, causing Windows to slow down. If memory is completely depleted, failures may result.
How to determine whether leak exists on windows?
If Windows performance is degrading over time and you suspect that a memory leak may be involved, the technique described in this section can indicate whether there is a memory leak.
Begin by launching Performance Monitor. To open Performance Monitor, use one of the following procedures:
- Open Start Menu, search for Performance Monitor, and click the result
- Use the Windows Key + R keyboard shortcut to open the Run command, type perfmon, and click OK to open.
After opening the Performance Monitor, add the following counters:
- Memory-->Pool Nonpaged Bytes
- Memory-->Pool Paged Bytes
- Paging File-->% Usage
How to find a User-Mode Memory Leak?
Use the following techniques to determine the cause of a user-mode memory leak:
- Using Performance Monitor to Find a User-Mode Memory Leak - determines which process is leaking memory
- Using UMDH to Find a User-Mode Memory Leak - can determine the specific routine that is at fault.
- Private Bytes is an estimate of the amount of memory (non-paged and paged) that a software component is using and it should be a stable number. A Private Bytes that keeps growing endlessly or that uses a high percentage of the total available memory of the computer could indicate a memory leak.
- Virtual Bytes is an estimate that includes the Private Bytes plus memory-mapped files, plus bytes that are awaiting to be re-allocated by a run-time environment's memory manager (standby list). Like Private Bytes, this number should also be stable and should not consume a high percentage of the total available memory.
Step 1 - Open your Windows Task Manager and inspect the Details page sorted from highest to lowest Memory usage.

Step 2 - Open a Windows Run box by pressing the Windows Key + R.
Step 3 - Type "perfmon" without quotes and press the OK button.

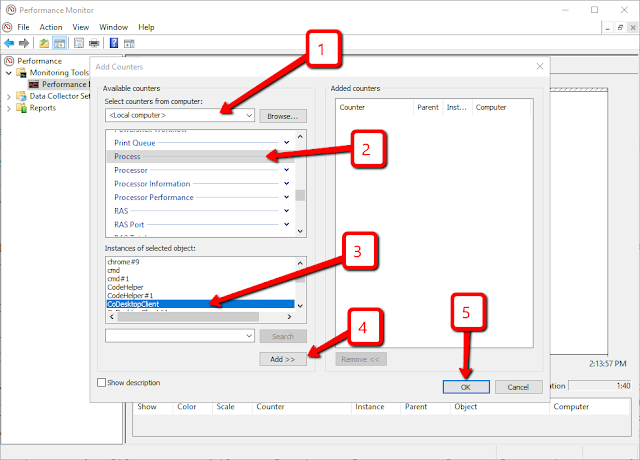
Step 4 -Click on the green plus-sign to add new performance counters.

Step 5 - Add new counters for <Local computer>, then select Process and then the CoDesktopClient process that had the highest memory usage in Task Manager (you may have more than one of these processes running).
Step 6 - Right-click on the bottom area and choose Properties...

Step 7 - Remove all Counters except Virtual Bytes and Private Bytes.

Step 8 - Hit the OK button to apply the filters.

Step 9 - Click on the view drop-down menu and choose Report.

Step 10 - Right-click on an empty area of the Report and Save Image As...

2) Using UMDH to Find a User-Mode Memory Leak
The user-mode dump heap (UMDH) utility works with the operating system to analyze Windows heap allocations for a specific process. UMDH locates which routine in a specific process is leaking memory.
The most important data in the UMDH logs are the stack traces of the heap allocations. To determine whether a process is leaking heap memory, analyze these stack traces.
The User-Mode Dump Heap (UMDH) tool, Umdh.exe, analyzes the Microsoft Windows heap memory allocations for a given process. UMDH has the following modes.
- Analyze a running process ("Mode 1"). UMDH captures and analyzes the heap memory allocations for a process. For each allocation, UMDH displays the size of the allocation, the size of the overhead, the pointer to the allocation and the allocation stack. If a process has more than one active memory heap, UMDH captures all heaps. This analysis can be displayed in realtime or saved in a log file.
- Analyze UMDH log files ("Mode 2"). UMDH analyzes the log files it has previously created. UMDH can compare two logs created for the same process at different times, and display the calls in which the allocation size increased the most. This technique can be used to find memory leaks.
How to find a Kernel-Mode Memory Leak
1) Using PoolMon to Find a Kernel-Mode Memory Leak
- If you suspect there is a kernel-mode memory leak, the easiest way to determine which pool tag is associated with the leak is to use the PoolMon tool.
- PoolMon (Poolmon.exe) monitors pool memory usage by pool tag name. This tool is included in the Windows Driver Kit (WDK). For a full description, see PoolMon in the WDK documentation.
2) Using the Kernel Debugger to Find a Kernel-Mode Memory Leak
You must first use GFlags to enable pool tagging. GFlags is included in Debugging Tools for Windows. Start GFlags, choose the System Registry tab, check the Enable Pool Tagging box, and then select Apply. You must restart Windows for this setting to take effect.
3) Using Driver Verifier to Find a Kernel-Mode Memory Leak (Verifier.exe)
- Driver Verifier determines whether a kernel-mode driver is leaking memory.The Pool Tracking feature of Driver Verifier monitors the memory allocations made by a specified driver. At the time that the driver is unloaded, Driver Verifier verifies that all allocations made by the driver have been freed. If some of the driver's allocations have not been freed, a bug check is issued, and the parameters of the bug check indicate the nature of the problem.
- The Driver Verifier Manager tool (Verifier.exe) is the preferred way to create and modify Driver Verifier settings and to gather statistics from Driver Verifier. Verifier.exe is located in the %WinDir%\System32 folder for every Windows installation.
- Driver Verifier Manager is the GUI included with Windows to configure Driver Verifier. Start the Driver Verifier Manager by using verifier.exe without any other command-line switches. Whenever switches are included, the command-line based version of the utility is used.
- For help with configuring Driver Verifier, run verifier.exe /? from an Administrator CMD window.

2. Click on Create custom settings (for code developers) and tap Next.


4. Now check the option Select driver names from a list and tap Next.

5. Now check the drivers you want to verify and then tap Finish.

You will be prompted to reboot your computer for the change to take effect. Click on OK to continue. The computer will reboot and driver verification will continue a the background.
- A thread uses the entire stack reserved for it. This is often caused by infinite recursion.
- A thread cannot extend the stack because the page file is maxed out, and therefore no additional pages can be committed to extend the stack.
- A thread cannot extend the stack because the system is within the brief period used to extend the page file.
- Global variables
- Local variables
- Function names and the addresses of their entry points
- Frame pointer omission (FPO) records
- Source-line numbers
- The debugger's symbol path is a string that consists of multiple directory paths, separated by semicolons.
- Relative paths are supported. However, unless you always start the debugger from the same directory, you should add a drive letter or a network share before each path. Network shares are also supported.
- For each directory in the symbol path, the debugger looks in three directories. For example, if the symbol path includes the c:\MyDir directory, and the debugger is looking for symbol information for a DLL, the debugger first looks in c:\MyDir\symbols\dll, then in c:\MyDir\dll, and finally in c:\MyDir. The debugger then repeats this process for each directory in the symbol path. Finally, the debugger looks in the current directory and then in the current directory with ..\dll appended to it. (The debugger appends ..\dll , ..\exe , or ..\sys , depending on which binaries it is debugging.)
- Symbol files have date and time stamps. You do not have to worry that the debugger will use the wrong symbols that it may find first in this sequence. It always looks for the symbols that match the time stamp on the binary files that it is debugging.
- One way to set the symbol path is by entering the .sympath command.
- Task List Viewer (TList), or tlist.exe, is a command-line utility that displays the list of tasks, or user-mode processes, currently running on the local computer. TList is included in the Debugging Tools for Windows
- If you installed the Windows Driver Kit in the default directory on a 64 bit PC, the debugging tools are located here:
- access violations
- alignment faults
- exceptions,
- critical section time-outs (deadlocks)
- in-page I/O errors.
- Access violations and data type misalignments are among the most common. They usually occur when an invalid pointer is dereferenced. The blame could lie with the function that caused the fault, or with an earlier function that passed an invalid parameter to the faulting function.
- Critical section timeouts (or possible deadlocks) occur when one thread is waiting for a critical section for a long time. These are difficult to debug and require an in-depth analysis of the stack trace.
- In-page I/O errors are almost always hardware failures. You can double-check the status code in ntstatus.h to verify.
- User-mode deadlocks arise when multiple threads, usually of a single application, have blocked each other's access to the same resource. However, multiple threads of multiple applications can also block each other's access to a global/shared resource, such as a global event, or semaphore.
- Kernel-mode deadlocks arise when multiple threads (from the same process or from distinct processes) have blocked each others' access to the same kernel resource.
- CDB
- WinDbg
- Procdump.
- If your computer stops working and displays a blue screen, the computer has shut down abruptly to protect itself from data loss. A hardware device, its driver, or related software might have caused this error.
- When Microsoft Windows encounters a condition that compromises safe system operation, the system halts. This condition is called a bug check. It is also commonly referred to as a system crash, a kernel error, or a stop error.
- If the OS were allowed to continue to run after the operating system integrity is compromised, it could corrupt data or compromise the security of the system.
- If crash dumps are enabled on the system, a crash dump file is created.
- If a kernel debugger is attached and active, the system causes a break so that the debugger can be used to investigate the crash.
- If no debugger is attached, a blue text screen appears with information about the error. This screen is called a blue screen, a bug check screen, or a stop screen.
- Use Process Explorer to display detailed process and system information
- Use Process Monitor to capture low-level system events, and quickly filter the output to narrow down root causes
- List, categorize, and manage software that runs when you start or sign in to your computer, or when you run Microsoft Office or Internet Explorer
- Verify digital signatures of files, of running programs, and of the modules loaded in those programs
- Use Autoruns, Process Explorer, Sigcheck, and Process Monitor features that can identify and clean malware infestations
- Inspect permissions on files, keys, services, shares, and other objects
- Use Sysmon to monitor security-relevant events across your network
- Generate memory dumps when a process meets specified criteria
- Execute processes remotely, and close files that were opened remotely
- Manage Active Directory objects and trace LDAP API calls
- Capture detailed data about processors, memory, and clocks
- Troubleshoot unbootable devices, file-in-use errors, unexplained communication, and many other problems
- Understand Windows core concepts that aren’t well-documented elsewhere
No comments:
Post a Comment